
Case Study
This case illustrates how the SPX Volatility Engine™ transitions from early compression to a clearly tradable long-biased structure…
Market Context
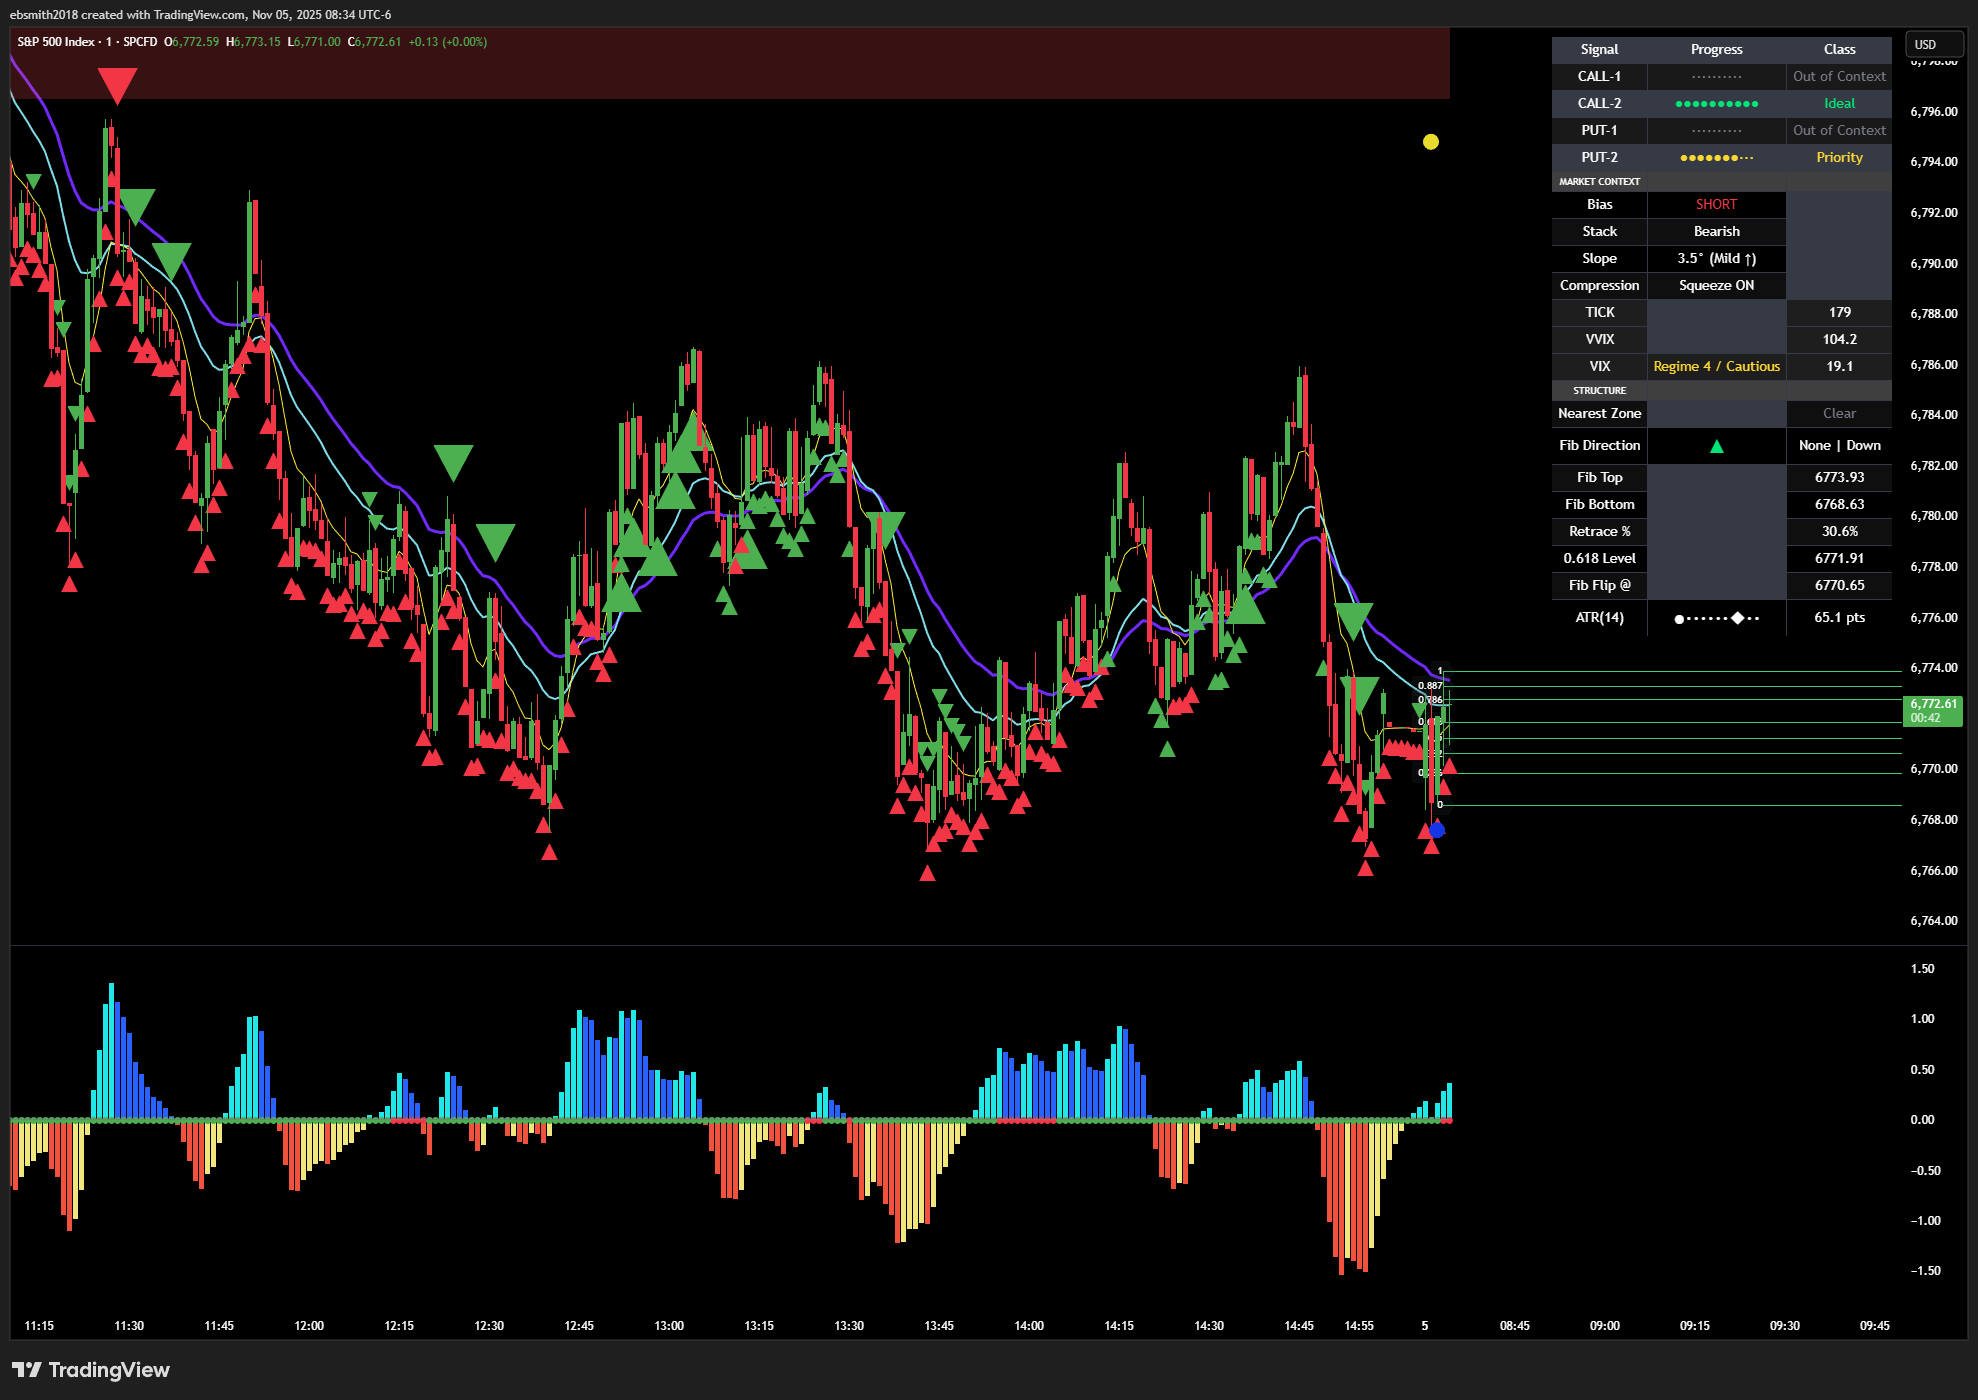
The morning of November 5, 2025 opened with tight intraday compression (red dots in lower pane) and little directional follow-through. SPX oscillated in a narrowing band, producing choppy, ambiguous movement that often punishes traders who act too early. The Bias is short in Regime 4 VIX / Cautious conditions – a mixed picture. This is where SVE’s job is not to find trades at all costs, but to identify when the structure itself becomes tradable.
As the session progressed, the Fibonacci trend flips to positive and CALL-2 Ideal signals emerge.
What SVE Detected Across the Sequence
17 minutes into this RTH session, SPX Volatility Engine (SVE) highlighted several important structural shifts:
Compression Release
The squeeze condition present at the open began to ease. The Keltner/Bollinger relationship pulled apart, indicating that pure range-compression was giving way to expansion potential.Positive Squeeze Histogram Slope
The histogram slope transitioned from negative to positive, confirming that momentum was leaning to the upside rather than oscillating randomly.EMA Relationship Changing
Shorter EMAs (e.g., 8/21) began to separate above longer ones, converting what had been overlapping “chop” into a more coherent stack though still Mixed.Structural Overhead
A well-defined overhead Supply zone (dark red band) is shown more than 20 SPX points above indicating room for price to move freely on the leading edge of the dynamic Fibonacci levels.
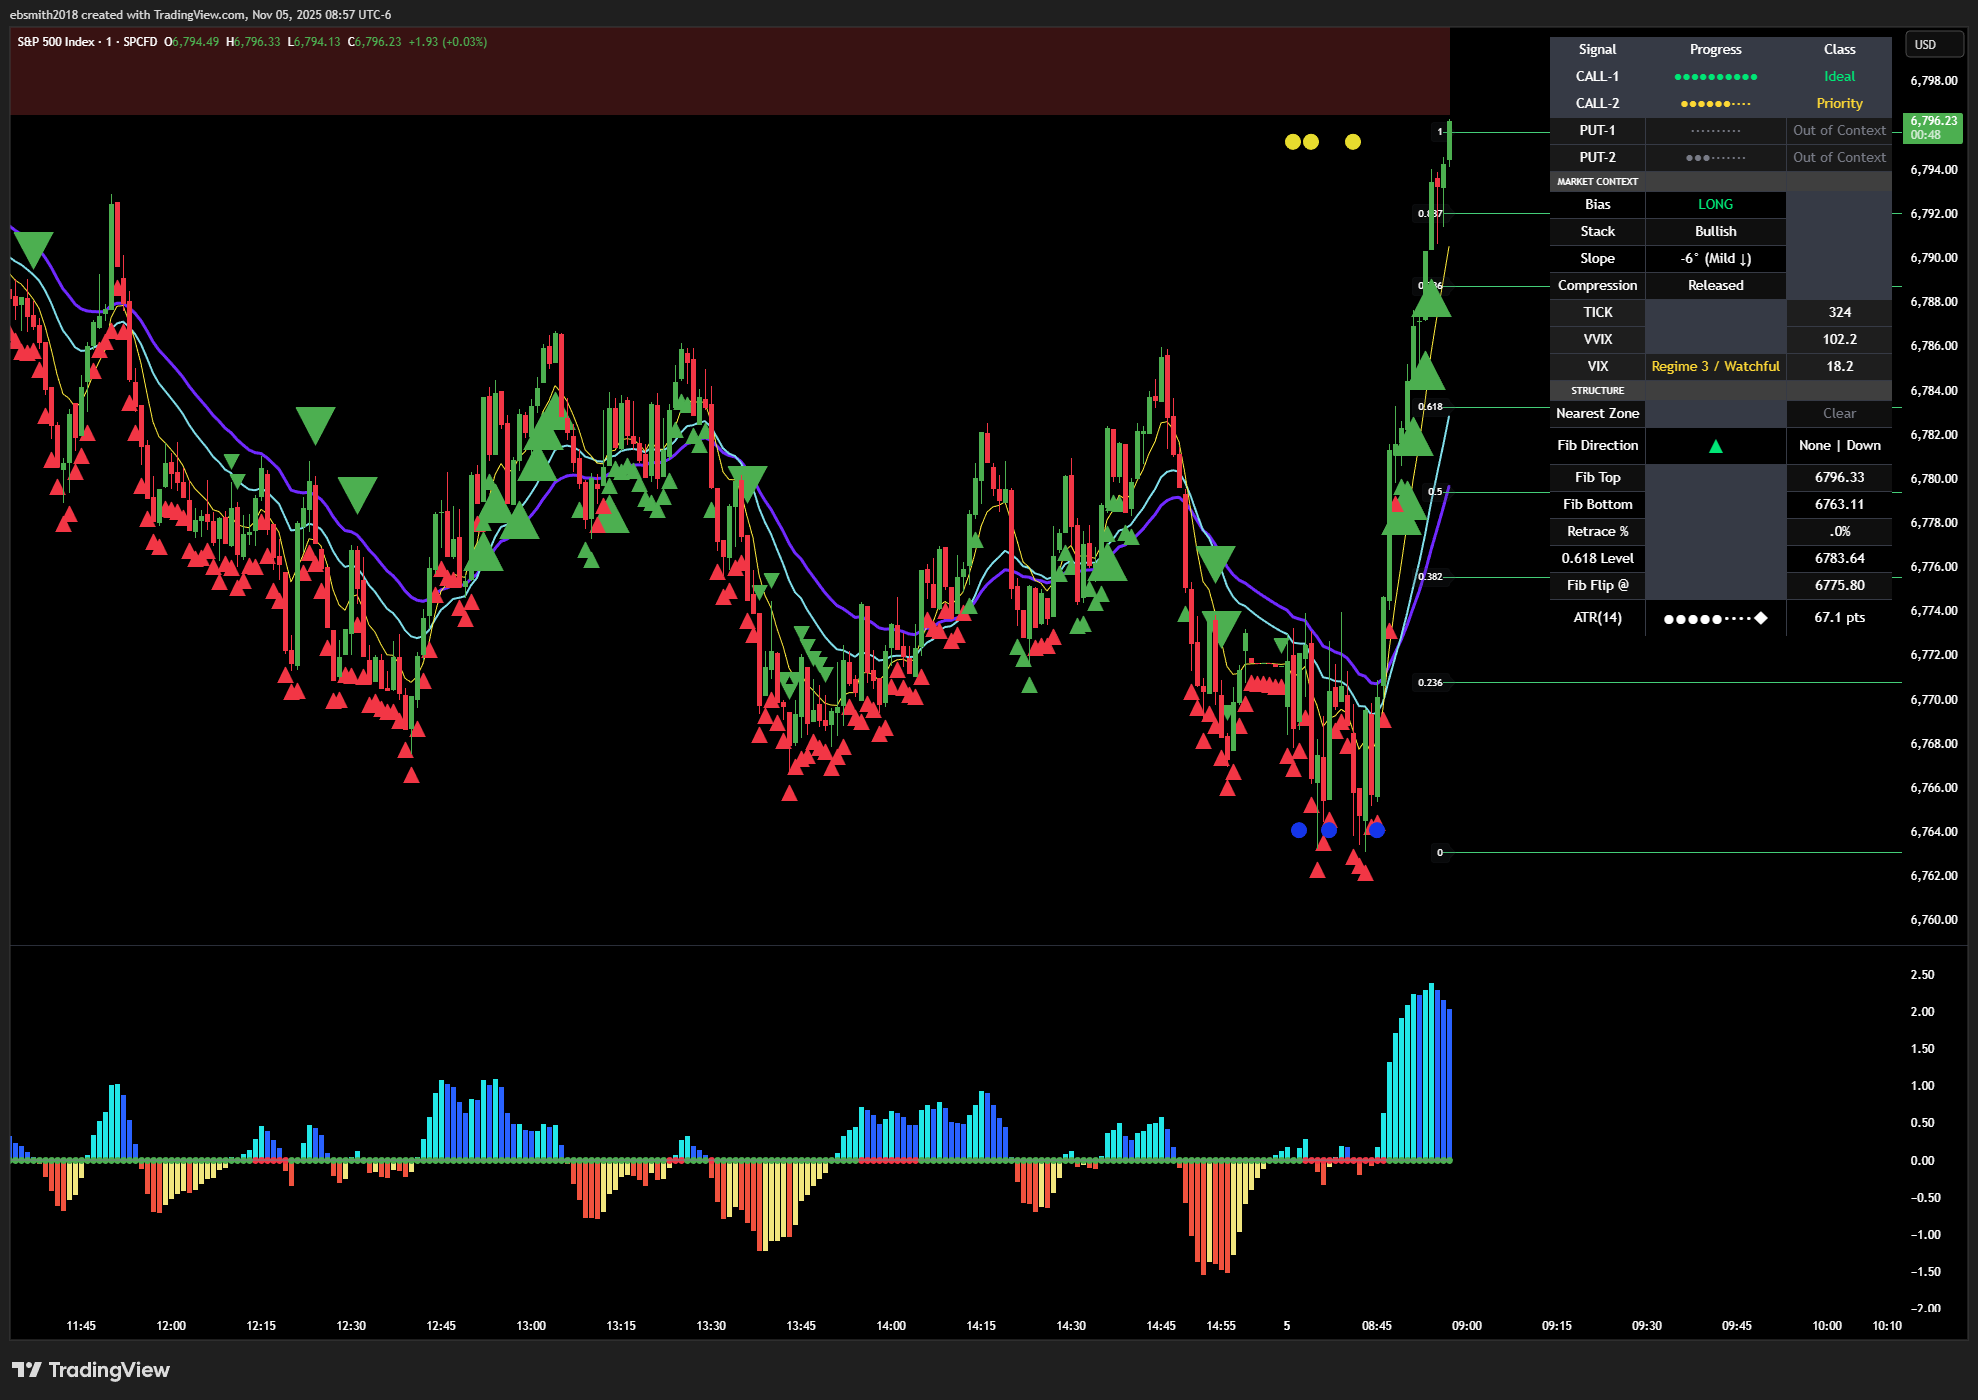
27 minutes into the session:
SVE has signaled a series of Ideal CALL-2 signals
SPX price rises strongly into an overhead supply zone.
CALL-2 signal has weakened to Priority as shown in the HUD.
The HUD confirms that VIX has fallen back into Regime 3 / Watchful.
Compression remains released, Bias is long, and the Fibonacci retracement levels have kept pace with price action in real time.
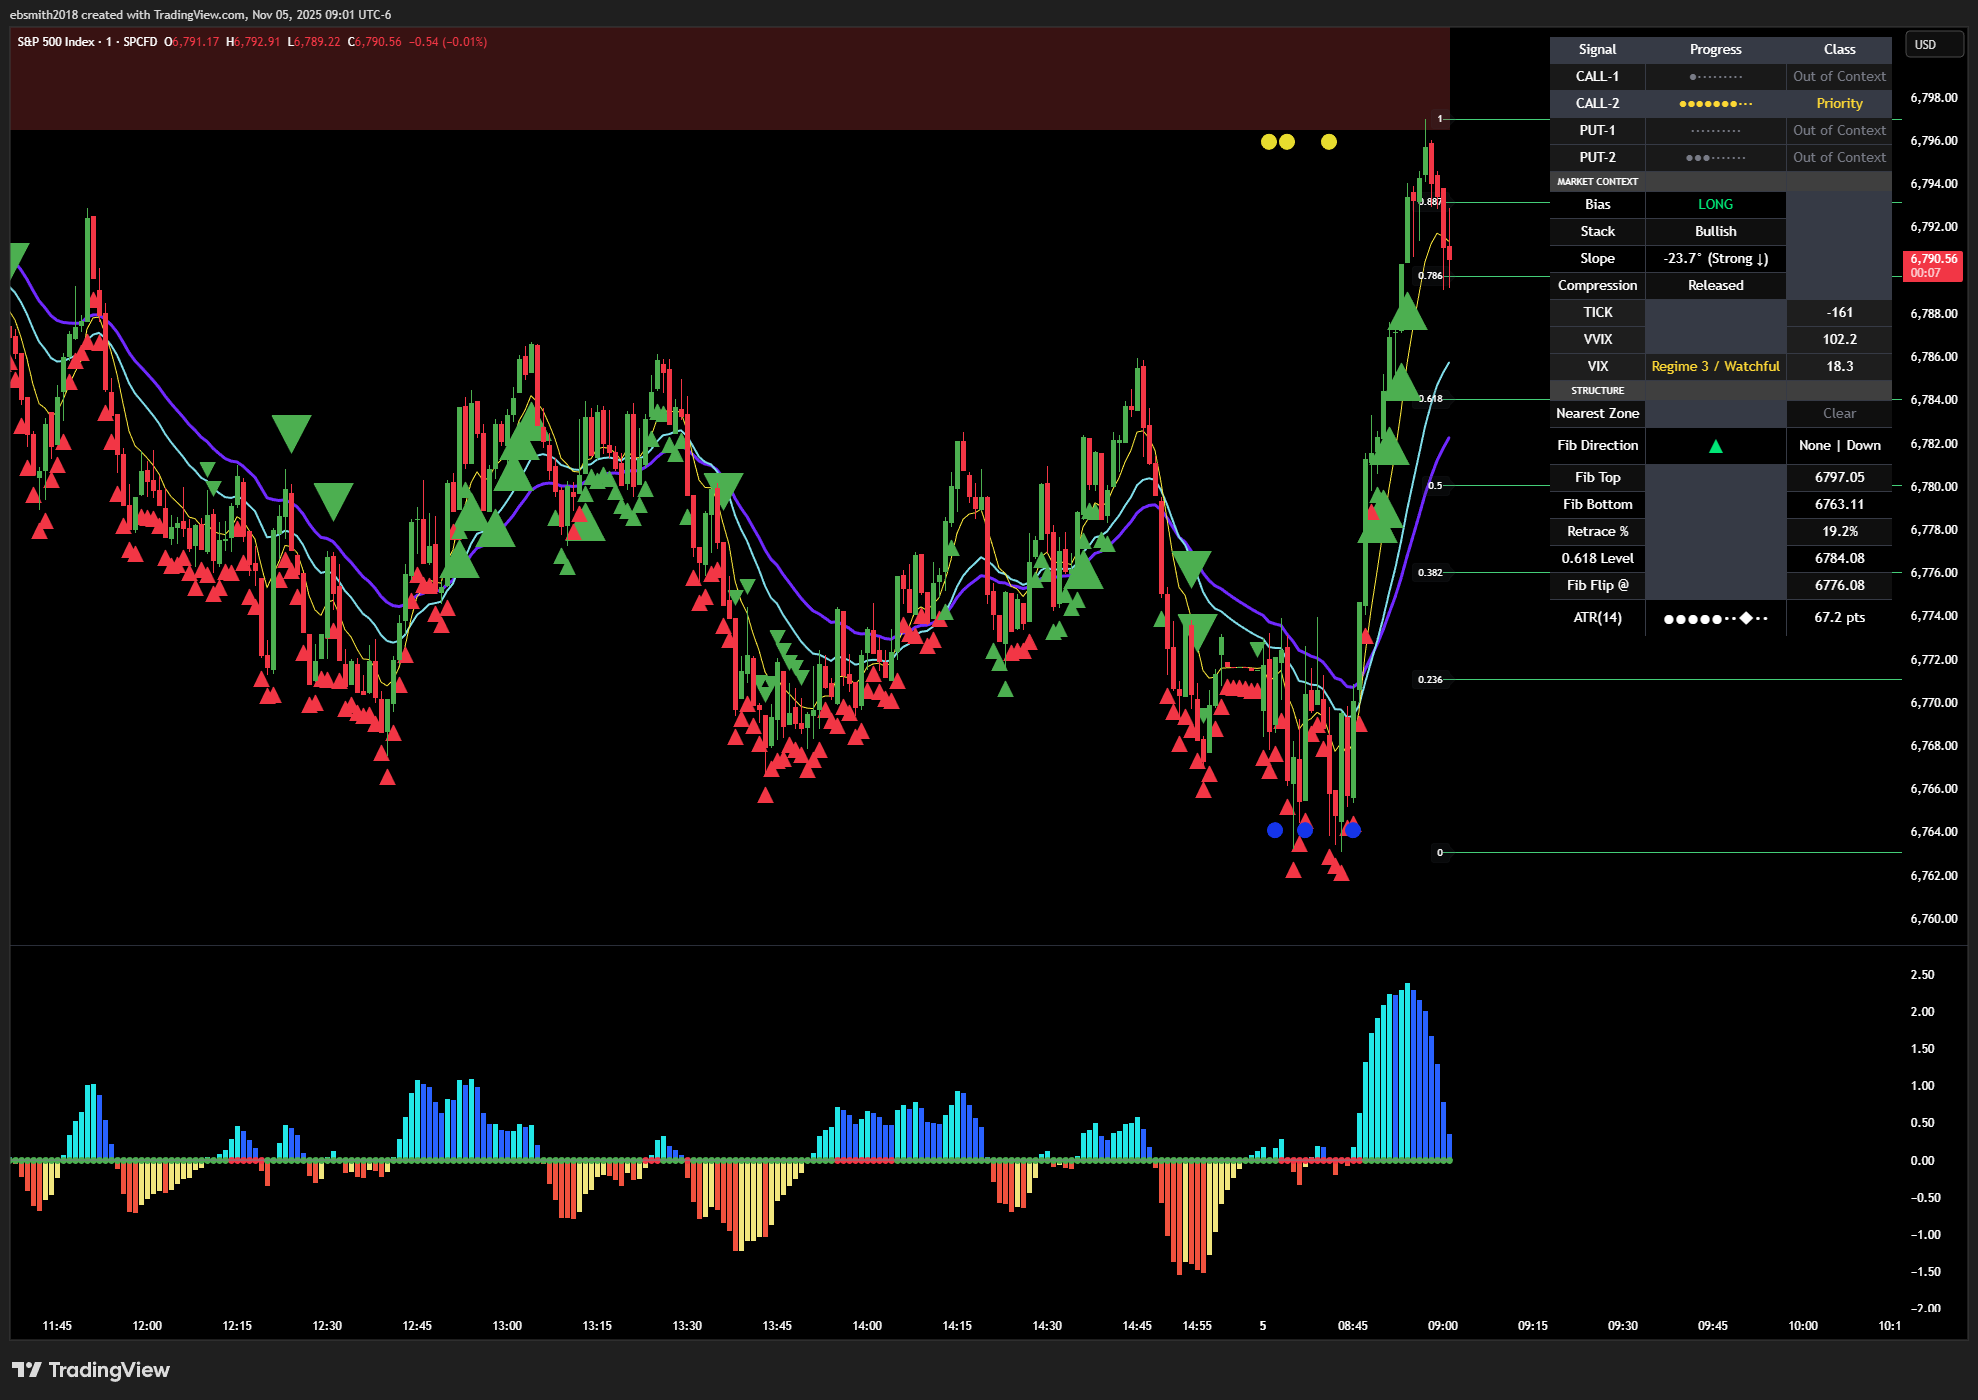
31 minutes into the session:
SPX has risen directly into and was rejected by the already defined supply zone.
CALL-1 signal has faded and is now Out of Context.
SPX price has retraced to the 0.786 Fibonacci level.
Squeeze histogram is sloped strongly negative
56 minutes into the session:
After rejection from the overhead supply zone, SPX retraces to near the 0.50 Fibonacci level of the current dynamic range before rebounding.
As price rebounds to near the 0.786 Fibonacci level, Ideal CALL-2 signals are visible.
Squeeze histogram has turned positive again after dipping negative along with price.
Bias remains long and EMA stack is bullish.

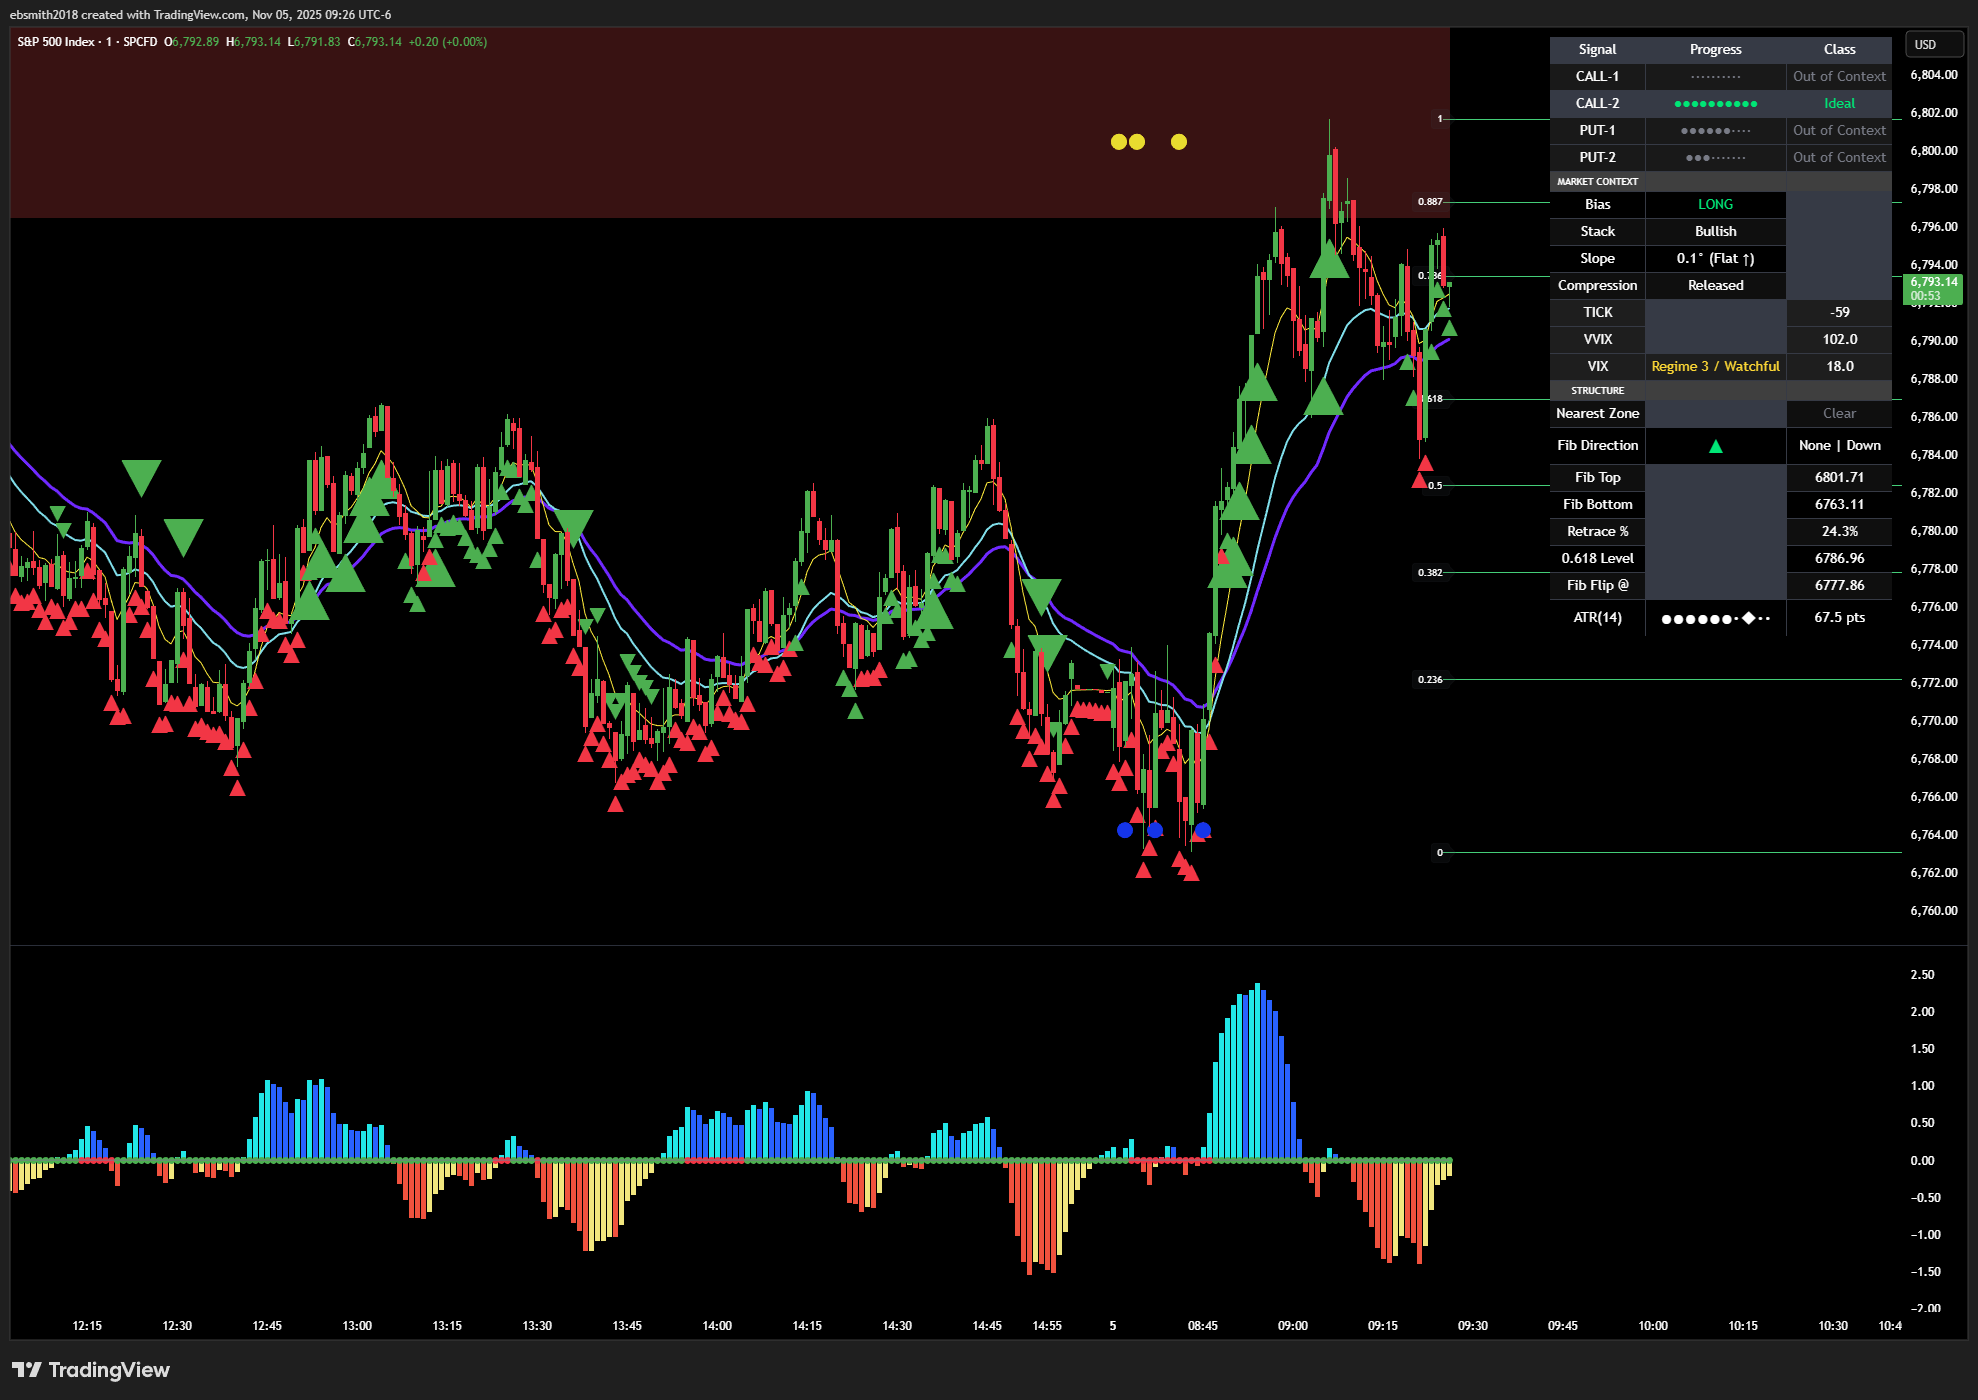
Summation of first hour of SPX trading:
Clear release of compression followed by CALL-1 and CALL-2 signals with overhead supply more than 33 points away allows price to move upward freely. A pullback of about 15 points finds support near a well-defined and visible Fibonacci level before fresh Ideal CALL-2 signals are seen at the close of the first hour of trading.
Daily price movement still well within the ATR(14) range shown in HUD.